Albania

336 sentences about China · since 1946 · Albania profile
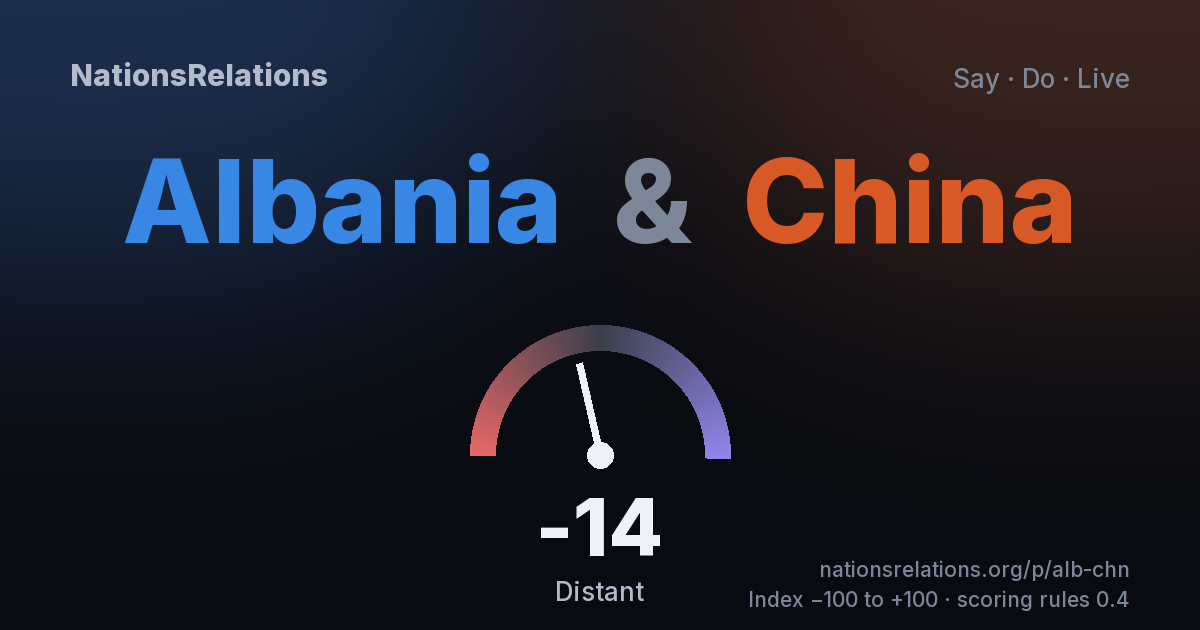
-14

China

0 sentences about Albania · since 1946 · China profile
Borders are for orientation only and say nothing about disputed territory.

Dashed outlines: areas whose status is disputed. Shapes follow Natural Earth, which draws some areas along recognised borders and others by who administers them on the ground; they say nothing about who is right, and front lines of current wars are not shown.

In short

  • At the UN their vote agreement is 48% (2022–2024), among the lowest either of them has with any country.48%vote agreement
  • Trade in goods ($1.3 billion a year) is very important for Albania, much less so for China.$1.3 billiona year
  • In its UN General Debate speeches, Albania names China far more often than the reverse (336 sentences against 0).336 · 0sentences
Written by fixed rules from the data below — no AI.

How the index is built

Each score runs from −100 to +100 and counts by its weight. The parts add up to the index.

UN votes 35% -30 score -87 · Vote agreement 48%High confidence
Trade 20% +17 score 84 · $1.3 billion a yearHigh confidence
Security 30% 0 score 0 · No armed conflict between the two governments recordedHigh confidence
Shared clubs 15% 0 score 0 · 0 shared groupsHigh confidence
Words–Not scored until people check the stance labels (0 of 336 checked)
Index-14
What matters to you? Adjust the weights
Explain this scorehow each number is built, step by step

Every score follows fixed rules written out on How it works; no AI is involved. Here are the steps for this pair, with its own numbers. How it works · JSON · Downloads

UN votes −87

  1. Votes are compared with each country's own voting partners, not with all pairs: most of the world votes alike, so a global ranking would make France–Germany +62 and Canada–United States +6.
  2. Among Albania's 191 voting partners, China ranks 185 (1 is the closest). That is position 3 on a scale from 0 (the furthest partner) to 100 (the closest).
  3. Among China's 191 voting partners, Albania ranks 172: position 10.
  4. The two positions are averaged (7) and stretched to the range −100 to +100: −87.

Inputs: Vote agreement 48% on recorded votes, 2022–2024 (the same vote counts 1, an abstention against a yes or a no ½).

Trade 84

  1. Trade is scored by how much the more dependent side relies on it: the larger of the two shares of total trade, here 10.3%.
  2. On a log scale, 0.1% or less scores 0 and 25% or more scores 100 (a percentile would make 0.1% of a country's trade look like a middling tie).
  3. (log10(10.3%) − log10(0.1%)) ÷ (log10(25%) − log10(0.1%)) × 100 = 84, kept between 0 and 100, so the score is 84.

Inputs: Goods trade both ways: $1.3 billion a year, 2023–2025 (IMF) · 10.3% of Albania's trade, 0.0271% of China's.

Security 0

  1. No fighting on opposite sides is recorded in the last 30 years, so security can only push up.
  2. Not both in NATO: +0.
  3. No fighting side by side is recorded: +0.
  4. Sum 0, capped at 80: 0.

Inputs: Opposed: never. Data to 2025. · Not both NATO members.

Shared clubs 0

  1. Each tracked group both belong to adds 25, and so does the same UN regional group. Capped at 100.
  2. 0 shared groups = 0 × 25 = 0.

Inputs: Tracked groups: EU, AU, ARAB, ASEAN, BRICS, G7, G20, GCC, P5.

Index −14

ScoreValueWeightCounts forAdds
UN votes−873535%−30.4
Trade842020%+16.8
Security03030%+0.0
Shared clubs01515%+0.0

The index is the weighted average of the scores that exist: (35×(−87) + 20×84 + 30×0 + 15×0) ÷ 100 = −13.7, shown as −14. Labels: 55 and up Very close, 25 Close, 0 Neutral, −30 Distant, below Opposed. Weights are yours to change above.

Words (what the two say about each other) are shown but not scored, and the people layer (migration, refugees, football) never is.

How sure are we?how much data stands behind each number

A score is only as good as the data under it. Four levels: High, Medium, Low, None. The thresholds are written on How it works; the level does not change a score, it tells you how far to trust it. How it works

UN votesHigh269 shared votes on whole texts in 2022–2024, the years the headline share covers. With that many, a share is good to about ±6 points.
TradeHighGoods trade is reported in 3 of the 3 years 2023–2025. Goods only, from customs data (IMF); services and energy pipelines are not in it.
SecurityHighThe Uppsala Conflict Data Program covers every state up to 2025. It counts only conflicts with at least 25 battle deaths a year.
Shared clubsHighThe list of tracked groups is fixed; membership is checked by hand.
IndexHighAs sure as the weaker of its two required parts, votes and trade. Security and shared clubs add to it but never make it surer.

Do their voting positions really differ?

In 2025, Albania stood at +0.99 (90% range +0.87 to +1.12) and China at −0.37 (−0.56 to −0.21) on the main dimension of UN voting. The gap is 1.36. Their 90% ranges do not overlap: on this dimension the two stand clearly apart.

Positions are the ideal points of Bailey, Strezhnev and Voeten, estimated from every recorded vote; higher means voting more like the United States and Western democracies. They are not a moral score.

Words (what the two say about each other) are counted, not scored, so they carry no level. Moments and the people layer are context and never enter a score.

01 · The story so far

Eighty years, one line

How closely they voted at the UN (vote agreement). Bands are eras found in the data itself; dots are moments; below, who led each country.

Vote agreement on recorded General Assembly votes on whole texts: the same vote counts 1, an abstention against a yes or a no ½, a yes against a no 0. Source: Nations on Record (agreement score of Voeten et al.; UN Digital Library). Leaders: Wikidata, checked by hand.

1971–1990
97%
vote agreement
1991–2024
64%
Further apart than before

From the data

1971The first time Albania named China in a UN General Debate speech.
1991Biggest fall in voting together at the UN: from 95% of votes the same in 1981–1990 to 68% in 1991–2000.
2025Their highest recorded trade in goods, adjusted for inflation: $1.6 billion both ways in 2025 US dollars ($1.6 billion in the dollars of the time).
Found in the data by four fixed rules, the same for every pair, not chosen by an editor. Never part of a score. The rules
  • Voting: the year with the biggest difference in vote agreement between the ten years before it and the ten years from it, if that difference is at least 15 points.
  • Armed conflict: every period of consecutive years in which UCDP records the two on opposite sides.
  • Trade: the year with the highest trade in goods both ways, adjusted for inflation with US consumer prices (BLS), if trade is recorded in at least five years.
  • Speeches: for each of the two, the first year it named the other in its UN General Debate speech, counted from the first year both voted at the UN (before that, a name can mean a territory or a state not yet independent).

02 · Say

In their own words

The conversation they never quite had: for each decade, what each government said about the other in its UN General Debate speech.

1950s
The Soviet Union, the People’s Republic of China, the People's Democracies and other peace-loving countries have made sincere efforts and taken concrete measures to bring about a gradual negotiated solution of the outstanding problems, with a view to paving the way for the elimination of blocs and military bases and for disarmament and peaceful co-operation among nations. Mr. Shtylla · Albania · 1959
1960s
This is confirmed, inter alia, by the agreements and plans of these two Powers in the field of nuclear weapons, including the bargaining at present in progress between their Foreign Ministers with regard to strategic arms; by the many deals, deceptions and pressures of all kinds in connexion with the question of Viet-Nam and that of the Middle East; by the aggression against Czechoslovakia and its military occupation; by their haggling over the German question and over that of West Berlin; by their joint plans to bring Europe and Asia under their sway and, in particular, by the encirclement of the People’s Republic of China and the war being waged against it and in many other ways. Mr. BUDO · Albania · 1969
1970s
In the shadow of and in collaboration with the United States, social-imperialist China is seeking to create spheres of domination, to become the principal military Power in that zone, and to establish its domination in Asia and throughout the Pacific. Nase · Albania · 1979
1980s
The countries of South-East Asia, which for decades have suffered from cruel colonial oppression and exploitation and have been subjected to imperialist aggression, are still under the political and military threat of the United States, the Soviet Union and China, which are doing their utmost to pit them one against the other, to pave the way for their interventions and to safeguard their hegemonistic positions. MAULE · Albania · 1982

Quote rule: for each decade, the first sentence in the latest speech of that decade in which one names the other. Same rule for every pair and both sides.

Who talks about whom

AlbaniaChina

Words next to the name

When Albania speaks

aggression64
occupation22
nuclear18
cooperation9
dialogue5
solidarity5

A keyword in the same sentence, not a judgement of who did what.

03 · Do

Votes, trade, war and alliance

Topic by topic

Most alike on Middle East (88% of votes the same), furthest apart on human rights (38%), against 64% on all votes since 2010.

Human rights: the vote agreement fell from 27% (2010–14) to 6% (2020–25).

  • All roll-call votes 64% (range 61–66%) since 2010, 1444 votes · 75% all years 2010–14: 48% 2015–19: 49% 2020–25: 50%
  • Disarmament 63% (range 56–70%) since 2010, 178 votes · 71% all years 2010–14: 45% 2015–19: 45%
  • Middle East 88% (range 82–92%) since 2010, 191 votes · 91% all years 2010–14: 79% 2015–19: 77% 2020–25: 72%
  • Human rights 38% (range 32–44%) since 2010, 248 votes · 59% all years 2010–14: 27% 2015–19: 22% 2020–25: 6%
  • Colonialism 77% (range 67–84%) since 2010, 97 votes · 89% all years 2010–14: 73% 2015–19: 57%
  • Nuclear weapons 54% (range 47–61%) since 2010, 199 votes · 67% all years 2010–14: 32% 2015–19: 37% 2020–25: 35%
  • Economic development 72% (range 63–80%) since 2010, 94 votes · 85% all years 2010–14: 58% 2015–19: 60%

Vote agreement on roll-call votes, counted vote by vote the same way as the headline figure: the same vote counts 1, an abstention against a yes or a no ½, a yes against a no 0. Votes on amendments and single paragraphs are left out. Topics are the labels of the UN voting dataset; one resolution can carry several, and about 60% carry none. Disarmament, colonialism and economic development are coded together from 2019, so they count votes up to 2018. Bar: 2010–2025; mark: all years. Shares need at least five shared votes. The thin line on each bar is the 95% sampling range given the number of votes.

Votes that set them apart

Since 2010 they voted on 1444 whole-text resolutions together. On 315 one said yes and the other no; they differed in some way on 733. The 10 newest, newest first: (the API lists up to 50: API)

Roll-call votes on whole texts at the UN General Assembly, since 2010; amendments and single paragraphs are left out, as in the topic bars. Titles and document symbols: UN Digital Library via Nations on Record; votes: Voeten et al. A vote is not a statement about the other country, only about the text.

Voting positions over time

Each year's position on the main dimension of UN voting, with its 90% range. Where the shaded ranges overlap, the votes of that year cannot tell the two apart. The gap was 1.43 in 1971 and is 1.36 in 2025; it was widest in 1995 (2.66).

-3.0-2.0-1.00+1.0+2.0 19801990200020102020

Albania China

Show data table
YearAlbania90% rangeChina90% range
20250.990.87 – 1.12-0.37-0.56 – -0.21
20241.120.95 – 1.29-0.86-1.02 – -0.7
20231.050.89 – 1.23-0.85-1.02 – -0.68
20221.090.92 – 1.27-1.07-1.26 – -0.88
20211.010.86 – 1.18-0.41-0.58 – -0.24
20201.020.86 – 1.19-0.59-0.79 – -0.38
20191.020.87 – 1.17-0.45-0.63 – -0.27
20180.980.83 – 1.14-0.51-0.69 – -0.34
20170.990.81 – 1.17-0.31-0.49 – -0.14
20160.950.78 – 1.12-0.49-0.69 – -0.29
20150.890.71 – 1.06-0.26-0.45 – -0.11
20140.880.71 – 1.06-0.81-1.06 – -0.56
20130.910.71 – 1.11-0.6-0.82 – -0.37
20120.920.74 – 1.12-0.9-1.15 – -0.65
20110.970.77 – 1.18-0.57-0.81 – -0.34
20100.890.72 – 1.07-0.85-1.14 – -0.57
20090.810.64 – 0.97-0.57-0.8 – -0.35
20080.910.73 – 1.1-0.6-0.86 – -0.36
20070.970.78 – 1.16-0.5-0.73 – -0.29
20061.060.87 – 1.24-0.73-1.01 – -0.47
20051.451.26 – 1.64-0.68-0.94 – -0.44
20041.180.98 – 1.38-0.75-1.1 – -0.44
20031.180.99 – 1.36-0.92-1.24 – -0.64
20021.080.89 – 1.29-0.64-0.93 – -0.36
20011.351.05 – 1.66-0.55-0.81 – -0.31
20001.351.03 – 1.67-0.73-1.02 – -0.46
19991.010.79 – 1.24-0.6-0.85 – -0.34
19981.140.91 – 1.39-0.39-0.62 – -0.16
19971.110.91 – 1.34-1.21-1.54 – -0.89
19961.231.0 – 1.46-1.22-1.57 – -0.86
19951.010.78 – 1.25-1.65-2.01 – -1.3
19941.080.83 – 1.33-1.52-1.9 – -1.14
19930.960.74 – 1.16-1.42-1.78 – -1.03
19920.990.78 – 1.2-0.63-0.95 – -0.32
19911.020.88 – 1.17-0.39-0.7 – -0.1
1990-0.72-1.23 – -0.27-0.12-0.37 – 0.09
1989-0.85-1.39 – -0.42-0.04-0.26 – 0.17
1988-1.09-1.54 – -0.670.01-0.17 – 0.19
1987-1.5-1.8 – -1.20.170.01 – 0.32
1986-1.58-1.88 – -1.290.180.05 – 0.31
1985-1.25-1.53 – -1.00.20.06 – 0.32
1984-1.11-1.46 – -0.780.190.07 – 0.32
1983-1.31-1.67 – -0.990.180.05 – 0.32
1982-1.32-1.65 – -1.00.14-0.01 – 0.27
1981-0.98-1.38 – -0.59-0.08-0.27 – 0.11
1980-1.09-1.38 – -0.79-0.02-0.25 – 0.18
1979-1.9-2.3 – -1.52-0.11-0.36 – 0.13
1978-2.11-2.56 – -1.65-0.12-0.51 – 0.18
1977-1.6-2.13 – -1.04-0.84-1.38 – -0.33
1976-1.49-2.0 – -0.98-0.99-1.34 – -0.64
1975-0.42-0.85 – -0.03-0.2-0.56 – 0.11
1974-1.07-1.7 – -0.47-0.88-1.49 – -0.33
1973-0.14-0.68 – 0.32-0.09-0.55 – 0.34
1972-0.7-1.31 – -0.14-0.48-1.01 – 0.04
1971-2.17-2.78 – -1.52-0.74-1.43 – -0.13

Positions are the ideal points of Bailey, Strezhnev and Voeten, estimated from every recorded vote; higher means voting more like the United States and Western democracies. They are not a moral score. Source: Nations on Record (Bailey, Strezhnev and Voeten).

On the UN voting map

In 2020–24, Albania voted with United States, Japan and 38 others (41 countries in all) and China with Russia, Iran and 7 others (10). They shared a bloc in 1 of the 6 periods since 1946.

Loading the map…

Drag the year to see how the blocs changed since 1946.

Each dot is a country, placed by how alike it voted that year: close dots voted alike. Colours are voting blocs, groups of countries among each other's closest voting partners in that period. The axes have no units; the United States is kept on the right and China at the top. Click a dot to open that country's pair with Albania. Source: Nations on Record, which shows the blocs in full. Inside the blocs (Nations on Record). Never part of a score.

Friends in common

The countries each one votes most alike with at the UN. Countries in the middle vote alike with both.

Trade over time

Albania sells to ChinaChina sells to Albania

Goods exports, current US dollars. IMF via Nations on Record.

Who needs whom

Arrow width: yearly goods flow in each direction (2023–2025). Bars: share of each country's total trade.

Security

No armed conflict between the two governments, and no fighting side by side, is recorded since 1946.

Counted: the two governments on opposite sides, or one sending troops to fight against the other. Fighting with armed groups based in the other country is not counted. UCDP Dyadic Dataset 26.1, data to 2025.

Shared clubs

They share none of the groups we track.

EU, African Union, Arab League, ASEAN, BRICS, G7, G20, GCC, the P5 and UN regional groups. NATO counts under Security.

Trade agreements

No trade agreement between them is notified to the WTO.

Agreements notified to the WTO, in force or signed. When a bloc such as the EU signs as one party, the agreement links its members with the other side, not with each other. The status is as notified to the WTO; whether an agreement is still applied between these two countries is not checked. Source: WTO Regional Trade Agreements database.

Sanctions

No UN sanctions apply to either. Sanctions the two countries may impose on each other themselves are not tracked here.

Country regimes of the UN Security Council, the EU, the United States and the United Kingdom; thematic lists (terrorism, cyber, human rights) are left out, and so are other countries' own lists. A regime can target a government, officials or companies; it is not a measure of the relationship. Sources: EU Sanctions Map, OFAC (US Treasury), UK government. Never part of a score.

04 · Live

Between people

Governments argue; people move, study, flee and play football. None of this enters the index.

Living in the other country

International migrant stock, UN DESA 2024. By place of birth: this includes refugees, and people born before today's borders, for example in a state that later split.

Refugees & asylum seekers
0
from Albania in China
17
from China in Albania (2025)

UNHCR. Refugees and asylum seekers only: people given citizenship on arrival are not counted.

Ask about Albania & ChinaLocal AI · answers only from this page's data · numbers checked

The answers are written by an AI language model, not by the site's editors. It can be wrong; the numbers and sources on this page are the reference.

What changed recently

  • Voting together: down 9 points (2019–2021: 58%, 2022–2024: 48%).
  • Trade: up 93% ($698 million → $1.3 billion a year).

Sources & coverage

  • Speeches, mentions, votes, trade: Nations on Record, loaded 2026-10-12 20:33 UTC.
  • UCDP Dyadic and Battle-Related Deaths datasets, version 26.1, loaded 2026-11-14 20:06 UTC.
  • UN DESA International Migrant Stock 2024, loaded 2026-10-12 20:18 UTC. UNHCR Refugee Population Statistics (api.unhcr.org), 2000–2025, loaded 2026-10-12 20:18 UTC.
  • International football results 1872–present (Mart Jürisoo, CC0), loaded 2026-10-12 20:18 UTC.
  • Scoring rules 0.4 (14 Nov 2026), scores built 2026-11-14 21:20 UTC. Every rule.